FLOCMARK®
Computer vision analysis of biosludge images.
Biosludge structure analysis
According to Urban wastewater treatment directive (2024/3019 OF THE EUROPEAN PARLIAMENT AND OF THE COUNCIL), monitoring of wastewater treatment process should be supported by digital tools. Flocmark® is a perfect example of easy-to-use digital tool that creates immediate value for its user.
Computer vision application Flocmark® is built to analyse biosludge structure from microscopic images. It gives process engineers, lab specialists, and plant operators the ability to see deeper, respond faster, and manage biological treatment with confidence.
Flocmark® has been field-tested across a range of industries, including pulp, paper and board manufacturing, municipal wastewater treatment, and oil refining. It blends seamlessly into existing laboratory routines, making advanced image analysis part of daily workflow.

Upload and analyse
Biosludge images are uploaded to Flocmark® with web browser. Computer vision analysis is started with a simple click and results are displayed in user interface.
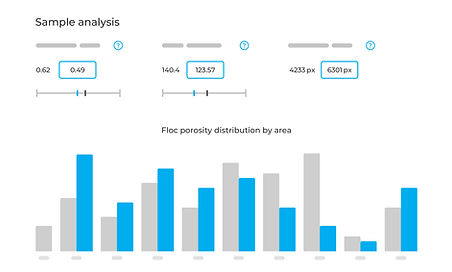
Image analysis covers the whole biosludge structure, including flocs, filaments and fine particles. More information of floc development is provided with floc size and porosity distributions.
Images are collected and saved in user archive, where historical samples and their data are easily accessible and can be compared to each other.


See results instantly
Analysis results are displayed as diagrams and numeric values. Sample comparison in the user interface allows users to compare biosludge structures and image data across samples.
Structural changes are often seen through visual interpretation and numeric comparison. Early indicators may appear only in data, making computer vision analysis a valuable addition to user interpretation of sludge quality.
Follow trends over time
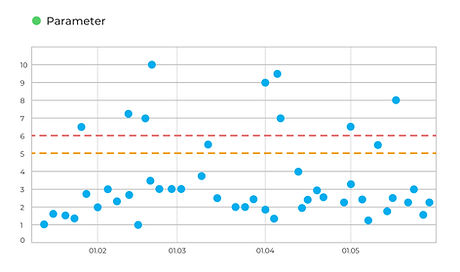
Biosludge structural development over time is best seen with trend categories providing information on floc formation, filament amount, and fine particles occurrence.
Good structural quality is often seen as low number of filaments and fine particles, high floc size, and low floc porosity.
For all parameters, user can define target areas and objectives. If a parameter is out of target, Flocmark® can raise predictive flags for early warnings indicating signs of process distress.


Export and share
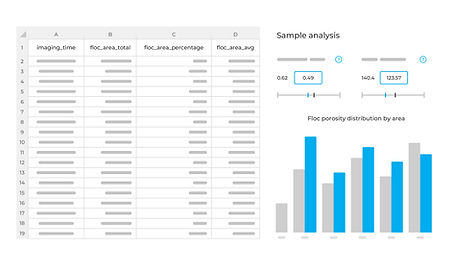
Export raw data as an Excel spreadsheet for further statistical work or data merging. For communication, generate a clean PDF report containing both numeric and visual summaries of your sample.
Whether it’s compliance, reporting, or team briefings — Flocmark® insights are ready to share instantly.
Workflow of sample analysis

Microscope imaging
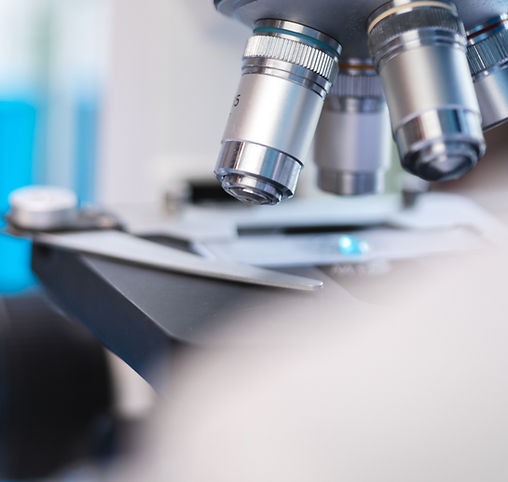
Images are taken by mill personnel with microscope that includes a digital camera.

Biosludge analysis
Analysis covers biosludge structure, including filaments, floc area, density, and size.

Standard camera setup
Camera settings are standardized by the magnification, brightness and resolution.

Downloadable data report
Results can also be downloaded as PDF or Excel sheet for further examination.

One-click analysis
Biosludge images upload via browser; analysis starts with one click and results show on screen.

Easy access to archives
Images are saved in an archive where samples and data are easily accessed and compared.
Benefits of using Flocmark®
Consistent interpretation
Variation in results interpretation is eliminated with consistent analysis.
Numeric structure data
Provide detailed information of biosludge structural development.
Insights into biosludge
Extracting numeric data of biosludge allows sample comparsion.
Early alerting system
Predictive alerts provide early indicators of process upsets.
Wastewater insights
Increase understanding of wastewater treatment dynamics.
Contact sales for more information
Flocmark® is a product and trademark owned by Toihan.
© 2025 All rights reserved.

